


Astronomers have discovered a new correlation using 100 years of solar data from the Kodaikanal Solar Observatory, which will help predict the strength of an upcoming solar cycle maximum as well as help in space weather forecasting.
The intricacies of the solar cycle and forecasting space weather are important fields of current research, including in India. Space weather is concerned with the varying conditions within the Solar System and its heliosphere influenced by the sun and solar wind. The main components of space weather are the solar wind, coronal mass ejections, and solar flares. They can compress the magnetosphere of the Earth and trigger geomagnetic storms, which can affect communication and power transmission, damage spacecraft electronics, and threaten the lives of astronauts. Thus, space weather has a profound influence on modern civilization.
Space weather is complicated by the fact that the activity of the Sun follows a roughly 11-year periodic cycle, measured in terms of variations in the number of observed sunspots on the Sun's surface. During the solar cycle, solar activities fluctuate from a period of minimum activity to a period of maximum activity back to a period of minimum activity. This affects the space weather, Earth's atmosphere, and climate variations. There is also cycle-to-cycle change in the strength of the solar cycle, which, in turn, influences the related phenomena. Therefore, predicting the amplitude of the solar cycle is one of the big challenges in astrophysics.
Astronomers use many different ways to forecast the strength of the next solar cycle. This includes theoretical calculations based on dynamo models, extrapolations, precursor methods, etc. The precursor method uses the value of some measure of solar activity at a specified time to predict the strength of the following solar maximum. Polar magnetic field strength around the sunspot minimum is generally used as a precursor of the strength of the next activity cycle. The bright magnetic features seen near the polar regions called polar faculae are considered the best proxy for the polar magnetic field.
In a recently published work, researchers from the Indian Institute of Astrophysics, Bengaluru, an autonomous institute of the Department of Science and Technology discovered that the width of the supergranular cells on the solar surface during the minimum year of the solar cycle is related to the number of sunspots seen during the subsequent solar cycle maximum. This simple method can be used in space weather forecasting.
The scientists studied the solar chromospheric images observed at 393.3 nm wavelength of Ca-K ion taken using the telescope that has been operating at the Kodaikanal Solar Observatory which is run by IIA, for more than 100 years. The publicly available data from the observatory (which is celebrating 125 years this year) with a span of more than nine solar cycles, each cycle extending for about 11 years, was used to detect the large-sized (30,000 km) convective patterns called supergranulations on the visible surface of the sun. These large-sized convective cells have borders around 5,000 km thick and are called supergranular lanes. The thickness of the supergranular lanes varies over the solar cycle.
“Our analysis shows that these supergranular lane widths were positively correlated with the sunspot number,” said Prof. K.P. Raju, from IIA, the lead author of the study. “We found that the supergranular lane widths obtained near the mid-latitudes during the period of sunspot cycle minima are strongly correlated to the amplitude of the following sunspot cycle,” he added.
“We were also able to establish that this correlation is weak or insignificant at other times. The lane thickness during other times of the solar cycle do not have predictive power over the strength of the next cycle,” said Prof. B. Ravindra, a co-author of the study along with Prof. Jagdev Singh and Prof. Muthu Priyal. The strong correlation of the two parameters thus provides a simple way to predict the strength of the next sunspot cycle by about 4–5 years in advance. These results published in the Astrophysical Journal Letters are important in space weather predictions and solar irradiance variations.
Publication link: https://doi.org/10.3847/2041-8213/ad13e9
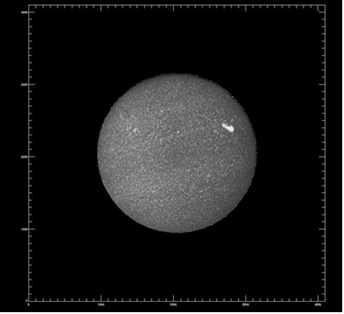
Figure 1. The image of the chromosphere taken in the Ca-K spectral line from the Kodaikanal Solar
Observatory telescope on 1 November 1914.
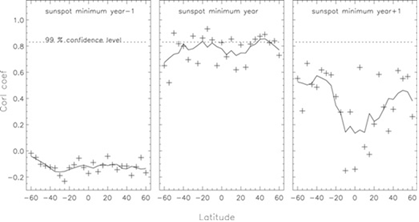
Figure 2: Plots of correlation coefficient between supergranular lane width and the sunspot number maximum vs. solar latitude for three epochs. It is clearly seen that the correlation holds only for the lane width measured during the sunspot minimum year preceding the maximum.
")


")


