


Researchers studying the Leh Valley in Ladakh to assess its vulnerability to debris flows have prepared a susceptibility map using high-resolution digital elevation models responding to the urgent necessity of predicting landslides and of town planning, specifically with the increase of uncertainty of extreme climatic events in the last decades.
Mass wasting processes such as debris flows and landslides are one of the notorious geological phenomena that have been causing huge threats in the Himalayan region. The Leh valley in Ladakh state has witnessed many debris flows in the past several years. In 2010, an intense storm resulted in floods in Leh that triggered a series of debris flows leading to the loss of at least 600 lives and destroyed public and private infrastructure. These debris flows were documented by researchers who found that the production of enormous amounts of sediments on the hill slopes was the reason of its origin, and this has worsened by the unpredictability of extreme climatic events in the last decades.
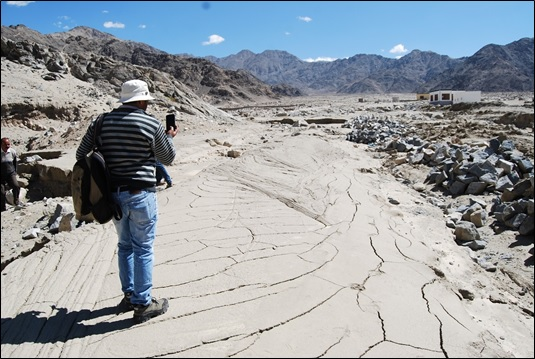
Figure 1 Debris flow located at Thiksey, Leh Valley
To address this problem, researchers at the Wadia Institute of Himalayan Geology (WIHG), an autonomous Institute under the Department of Science & Technology (DST), Govt. of India, mapped its topographic condition using a precise differential global position system. It suggests that if the sediment-stuffed hill slopes have high connectivity with the downstream area, there is a large likelihood that even a small debris flow event initiated in the headwater region can turn into a disastrous event downstream. Therefore, a detailed investigation of the topography in the context of debris flows is needed for town planning.
The team of researchers consisting of Choudhurimayum Pankaj Sharma, Anil Kumar, Poonam Chahal, Uma Kant Shukla, Pradeep Srivastava, and Manoj K. Jaiswal used three independent methods to prepare a debris flow susceptibility map. They are the Index of connectivity model, Flow-R, and the Weights of evidence methods. The Index of connectivity model was used to derive the degree of connection between the source of sediments and its sink. The Flow-R model simulated the extension of flow events by considering probable source areas and the mechanism of flow. The weights of evidence method were used for probabilistic-based prediction of debris flow occurrence based on the statistical correlation of past occurrence and various topographic conditions.
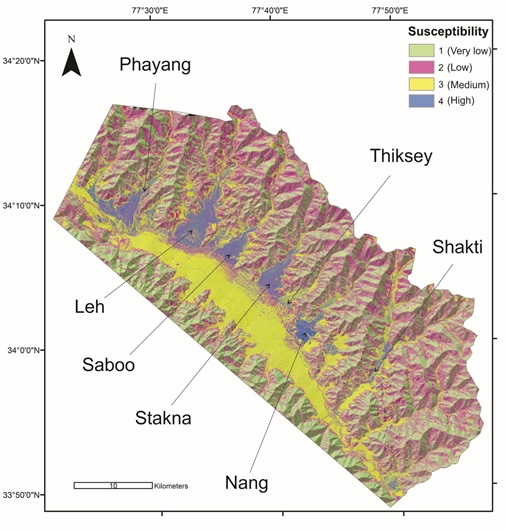
Figure 2 Debris flow susceptibility map built using Weights of Evidence Method
The index of connectivity and Flow-R simulation were counter-supportive and adequate in delineating high-risk zones in highly rugged parts of the region. However, they seem to possess limitations in the relatively fat and extensive distal parts of an alluvial fan system. The susceptibility model constructed based on the weights of the evidence method fills up this gap. The results of this study published in the journal Natural Hazards can be used as preliminary data though they recommend further development of the susceptibility model. In addition, preparation of a detailed inventory map of past debris flows has been recommended for much more improved prediction accuracy.
Publication link: https://doi.org/10.1007/s11069-022-05619-x
")


")


