


A new methodology developed to analyze images of the Sun in white light can help obviate temporal and latitudinal variations in observations related to instrument and sky conditions. It can help in accurate analysis of the historic time series of images of Sun and in understanding the dynamics of the sun, solar cycle variations, dynamo processes in the convection zone and resulting long term climatic variations on the earth.
It is known that there are large numbers of regions of weak magnetic field on the sun which vary with time. These can be studied using magnetograms and Ca-K line images of the sun as there is strong correlation between the magnetic field and the Ca-K line intensity of the region on sun. The magneto-grams are available for short period and the characteristics of the instrument are changing with time. The change in instrument makes it difficult to study the long term variations on the sun. But, Ca-K line images are available for long period at Kodaikanal observatory (KO), for more than 100 years with no change in the optics of the instrument. Similarly, other observatories in the world, such as Mount Wilson Observatory (MWO) have this type of data for about 70 years.
These images can be used to study the long term variations on the sun. The data from various observatories gave different results due to varying configuration of the instruments used. Also, large amount of scatter in the derived results due to day to day variation in setting the instrument and the sky conditions. There are long term variations in results due to change in the emulsion used to record the images. Hence, derived results were averaged over large periods to study variations over the long periods and correlate the data from different observatories. This caused large amount of uncertainty in the result.
To overcome this limitation of data analysis, Jagdev Singh, Muthu Priyal and Ravindra, scientists from Indian Institute of Astrophysics, (IIA) developed a new methodology to analyze the Ca-K line images that compensates for all the issues related with instrument and sky conditions. The new methodology called Equal Contrast Technique (ECT) has been accepted for publication in the Astrophysical Journal. Using the data obtained at Kodaikanal observatory the scientists have shown that correlation between derived plage area (bright region in the sun’s chromosphere) from the Ca-K images and sunspot number is excellent, even on daily basis, over a period of about 100 years for the first time.
This type of accurate analysis of the historic time series of Ca-K images can be useful for reliable and accurate investigation of variations on the sun and the effect of this on the climatic condition of the earth.
References:
Temporal and latitudinal variations of Ca-K plage and network area: An implication to meridional flows, Priyal, M., Singh, J., Ravindra, M. and Sindhuja, G., 2023, ApJ, (accepted)

The left and right side figures show the sun as observed in Ca-K light during the active and quiet phase of the sun.
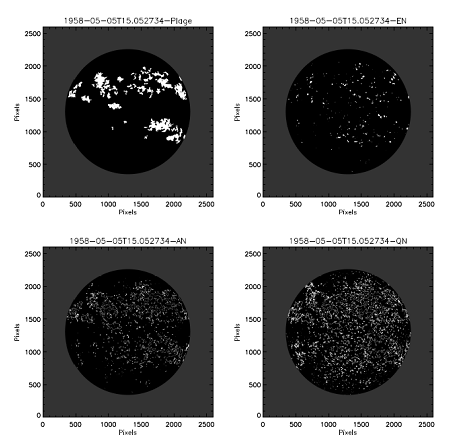
Figure-1. Binary images of the identified plages, EN, AN, and QN for the Ca-K image obtained on May 5, 1958.
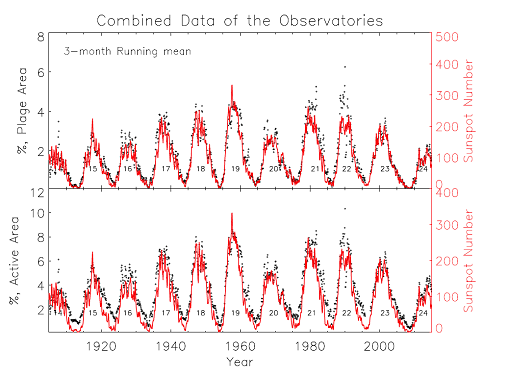
Figure 2. The black curve in top panel of the figure shows the percentage of plage area determined after combining the measurements from spectroheliograms and filtergrams from KO, MWO and PSPT (MLSO). The data represents 3-month running average of monthly mean of the percentage of plage area. The over-plotted red curve indicates sunspot numbers for comparison. The bottom panel indicates the data for the percentage of active area. The solar cycle number is also indicated in the figure.
")


")


