


Astronomers observing a much-studied blazar (feeding Super Massive Black Hole) 4.4 Gigalight years away, have detected its luminosity flickering at multiple temporal frequencies (quasiperiodic oscillations or QPOs with different periods). Detection of QPOs is as it is rare, but the new finding stands out due to the fact that multiple evidence of QPOs with different frequencies is even more rare. The data has helped the scientists estimate the upper mass limit of the blazar to be around 1,35 × 10⁹ times the mass of the Sun. It will also aid them in understanding the machinations in the innermost regions of the rapidly rotating gas (the accretion disc) that spirals around the blazar.
A blazar, which endures a huge amount of continuous mass accretion, is a feeding Super Massive Black Hole (SMBH) at the center of a distant galaxy, where its size is negligible as compared to the host galaxy. Yet it dominates the rest of the galaxy in luminosity, emanating a relativistic charged particle jet viewed face-on from Earth. These objects emit radiation in the complete electromagnetic (EM) spectrum depicting extremely irregular and erratic variability behaviors in their luminosity. Hence getting a sign of periodicity there is a rarity, needing a very large amount of data for its detection since these periodicities can scale up to many years. Quasiperiodic oscillations (QPOs) take the form of narrow peaks in the temporal frequency domain of their light curve. They are thought to be caused by processes occurring in the disc and/or near the base of the jet.
A three members team comprising a research scholar and a scientist from the Aryabhatta Research Institute of Observational Sciences (ARIES), India, and a scientist from the Department of Physics, The College of New Jersey, USA, explored data from TESS (Transiting Exoplanet Survey Satellite) of NASA that was launched to keep eyes over bright stars outside the solar system and find any exo-planets hosted by those stars. They have used this telescope to search for QPOs in the time series data of blazar S4 0954+658, and find its SMBH mass, which is known for its optical outburst in 2015.
By analyzing an archival data spanning about 160 days of observations taken by TESS, the team detected multiple signatures of QPOs with differing periods at different epochs of observations of the blazar. A detailed temporal study of the source was carried out for the whole data, and a SMBH mass limit has been estimated as well. The work has been published in The Astrophysical Journal.
Mr. Shubham Kishore (Senior Research Fellow, ARIES, India), in collaboration with his Ph.D. supervisor Dr. Alok C. Gupta (Scientist – F, ARIES, India), and Prof. Paul J. Wiita (USA), analysed the data archived by the TESS and detected the existence of multiple periodicities at different time epochs. Along with the appearances of flux oscillations of the varying time periods, the team also found a frequent emergence of one particular time period of 1.52 days at different times.
According to the researchers, short-term formations and their vanishings of single/multiple hot-spot(s) at different locations near the inner region of an accretion disc surrounding the SMBH is responsible for the observed days-scale oscillations in the object’s luminosities. They used this information and the appearance of a frequent period of around 1.52 days to calculate the upper mass limit of the blazar.
Publication details:
DOI: 10.3847/1538-4357/aca809
https://iopscience.iop.org/article/10.3847/1538-4357/aca809
For more details, Mr. Shubham Kishore (Senior Research fellow), amp700151alok[at]aries[dot]res[dot]ingmail.com) could be contacted.
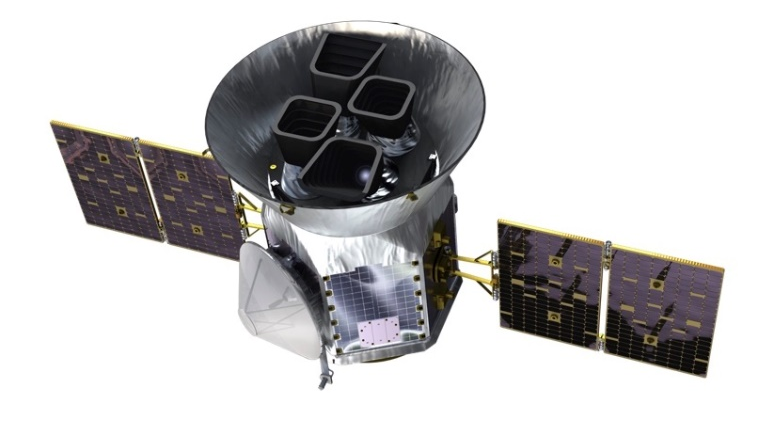
Figure 1: Artist's conception of the TESS spacecraft and payload.
Image Credit: MIT
Image source: https://heasarc.gsfc.nasa.gov/docs/tess/the-tess-space-telescope.html
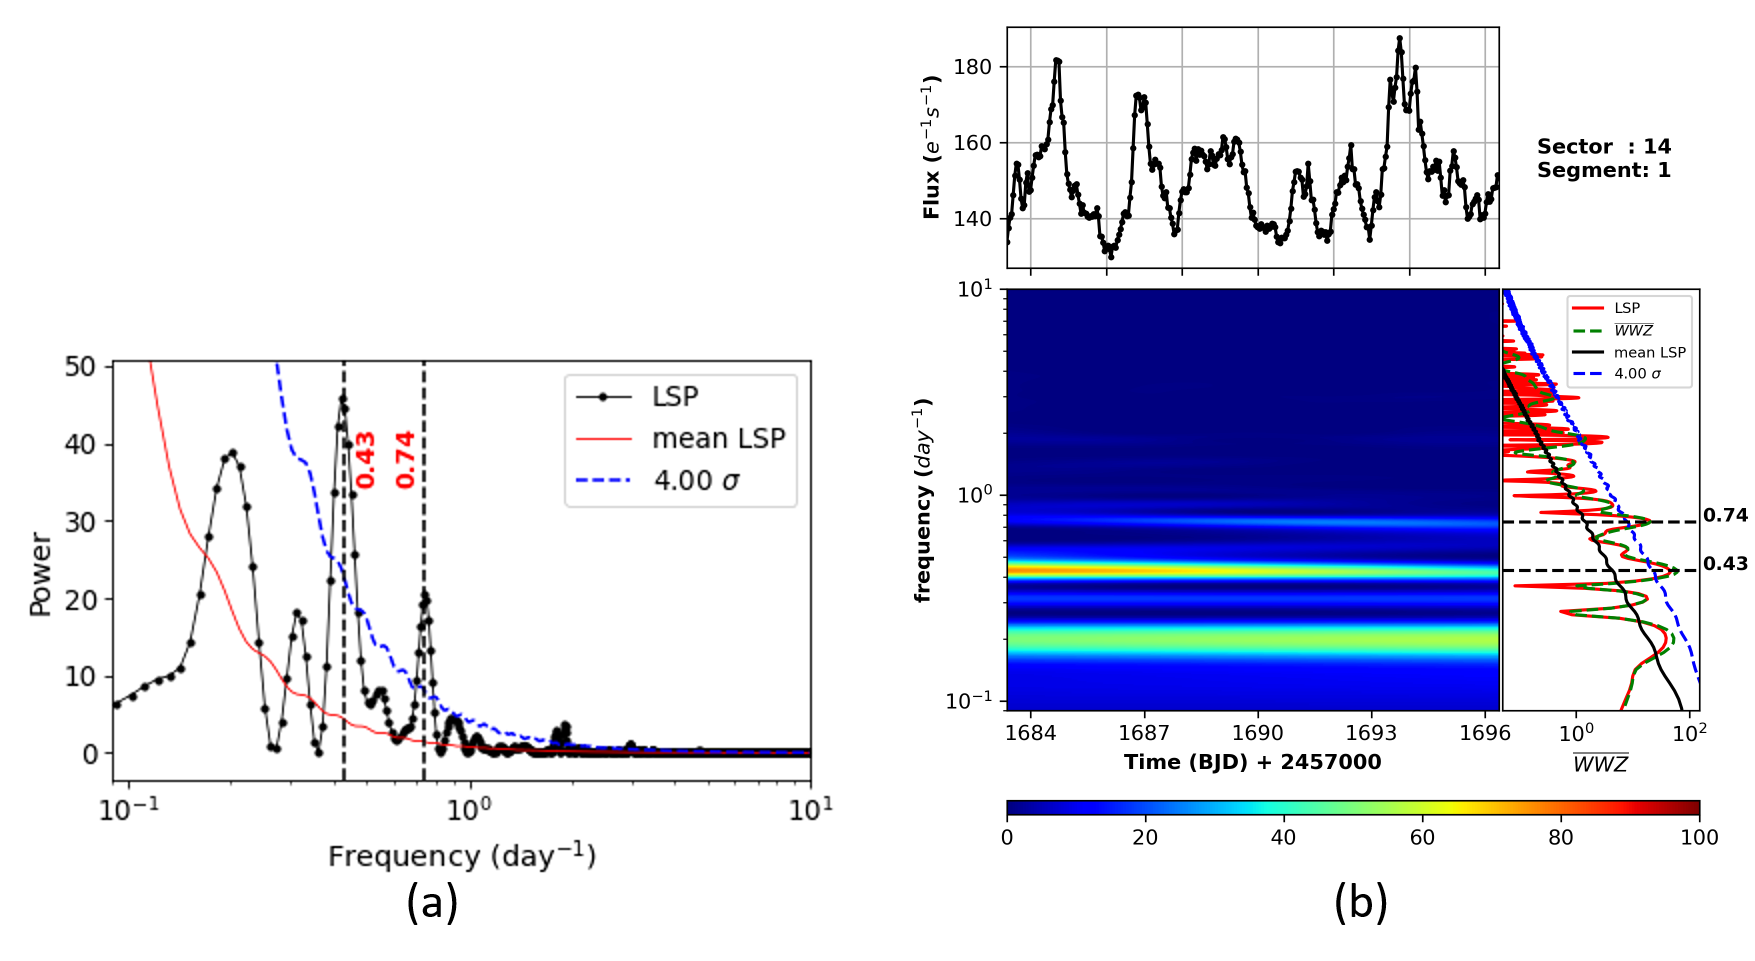
Figure 2: (a) The Generalized Lomb-Scargle Periodogram (GLSP) of the lightcurve (LC) of S4 0954+658 in Sector 14, Segment 1 showing two significant frequency peaks. (b) The upper plot is the 1 hour binned LC corresponding to the same segment. The lower left figure is the WWZ transform of this LC, showing the power in time and frequency domains. The lower right panel includes the time-averaged periodogram of the WWZ transform, the GLSP, the mean LSP (GLSP-fit) and the 4σ significance level.
Image source: Kishore et al. 2023
")


")


